How the six different tracks in Revs compare to each other
There are six different tracks that you can race around in Revs. The original 1985 game came with just one track, Silverstone, but later in the same year, just in time for Christmas, Acornsoft added Brands Hatch, Donington Park, Oulton Park and Snetterton in the form of the Revs 4 Tracks expansion pack. This enabled owners of the original Revs to choose from four new track data files when firing up the game, taking full advantage of the software hook that Geoff Crammond had cleverly built into the game code of the original release (see the deep dive on secrets of the extra tracks for more details).
The sixth Revs track, the Nürburgring, was released on the Commodore 64 as part of Firebird's 1987 release Revs+, which bundled all six tracks with an enhanced version of the game (when compared to the original Firebird release). The improvements in Revs+, which included computer assisted steering (CAS) and joystick support, were already supported on the BBC Micro, but the Nürburgring track was unique to the Commodore platform and was never released for the game's original platform. (Happily, it has now been backported to the BBC as part of this very project; see the deep dive on backporting the Nürburgring track for details.)
This article compares the main statistics for all six tracks, and at the end you can find links to individual articles on each of the tracks that contain detailed maps, elevation profiles and more.
The main statistics
-------------------
Let's start by comparing the main statistics for each track. Note that in the tables below, we use the following abbreviations to save space:
- BH = Brands Hatch
- DP = Donington Park
- OP = Oulton Park
- SL = Silverstone
- SN = Snetterton
- NU = Nürburgring
| Track | BH | DP | NU | OP | SL | SN |
|---|---|---|---|---|---|---|
| Section count | 29 | 25 | 27 | 27 | 24 | 24 |
| Segment count | 914 | 719 | 982 | 819 | 1024 | 686 |
| Start segment | 0 | 209 | 38 | 807 | 181 | 434 |
| Segment generation | Dynamic | Dynamic | Dynamic | Dynamic | Static | Dynamic |
| Segment vector table | 40 | 40 | 40 | 40 | 255 | 40 |
| Novice lap time | >= 1:33 | >= 1:18 | >= 1:46 | >= 1:23 | >= 1:34 | >= 1:10 |
| Amateur lap time | <= 1:32 | <= 1:17 | <= 1:45 | <= 1:22 | <= 1:33 | <= 1:09 |
| Professional lap time | <= 1:28 | <= 1:13 | <= 1:41 | <= 1:18 | <= 1:29 | <= 1:05 |
| 1st gear ratio | 103 | 104 | 104 | 104 | 103 | 104 |
| 1st gear power | 161 | 161 | 168 | 161 | 161 | 161 |
| 2nd gear ratio | 74 | 69 | 68 | 80 | 66 | 69 |
| 2nd gear power | 116 | 106 | 111 | 125 | 104 | 106 |
| 3rd gear ratio | 60 | 60 | 58 | 64 | 53 | 53 |
| 3rd gear power | 93 | 93 | 93 | 99 | 82 | 82 |
| 4th gear ratio | 50 | 51 | 51 | 53 | 46 | 47 |
| 4th gear power | 79 | 79 | 82 | 82 | 72 | 72 |
| 5th gear ratio | 44 | 44 | 43 | 44 | 42 | 42 |
| 5th gear power | 68 | 69 | 70 | 69 | 65 | 65 |
| Novice base speed | 134 | 134 | 130 | 134 | 134 | 134 |
| Amateur base speed | 146 | 146 | 140 | 146 | 146 | 146 |
| Professional base speed | 152 | 152 | 145 | 152 | 152 | 152 |
| Start position | 5 | 4 | 4 | 3 | 4 | 8 |
| Car spacing | 37 | 33 | 33 | 33 | 40 | 33 |
| Timer adjust | 70 | 20 | 50 | 93 | 24 | 45 |
| Race slowdown | 0 | 0 | 0 | 0 | 0 | 0 |
| Track hook | Yes | Yes | Yes | Yes | No | Yes |
Comparing the track sizes
-------------------------
Now let's compare the track sizes. Putting all the tracks onto the same graph shows their relative sizes:
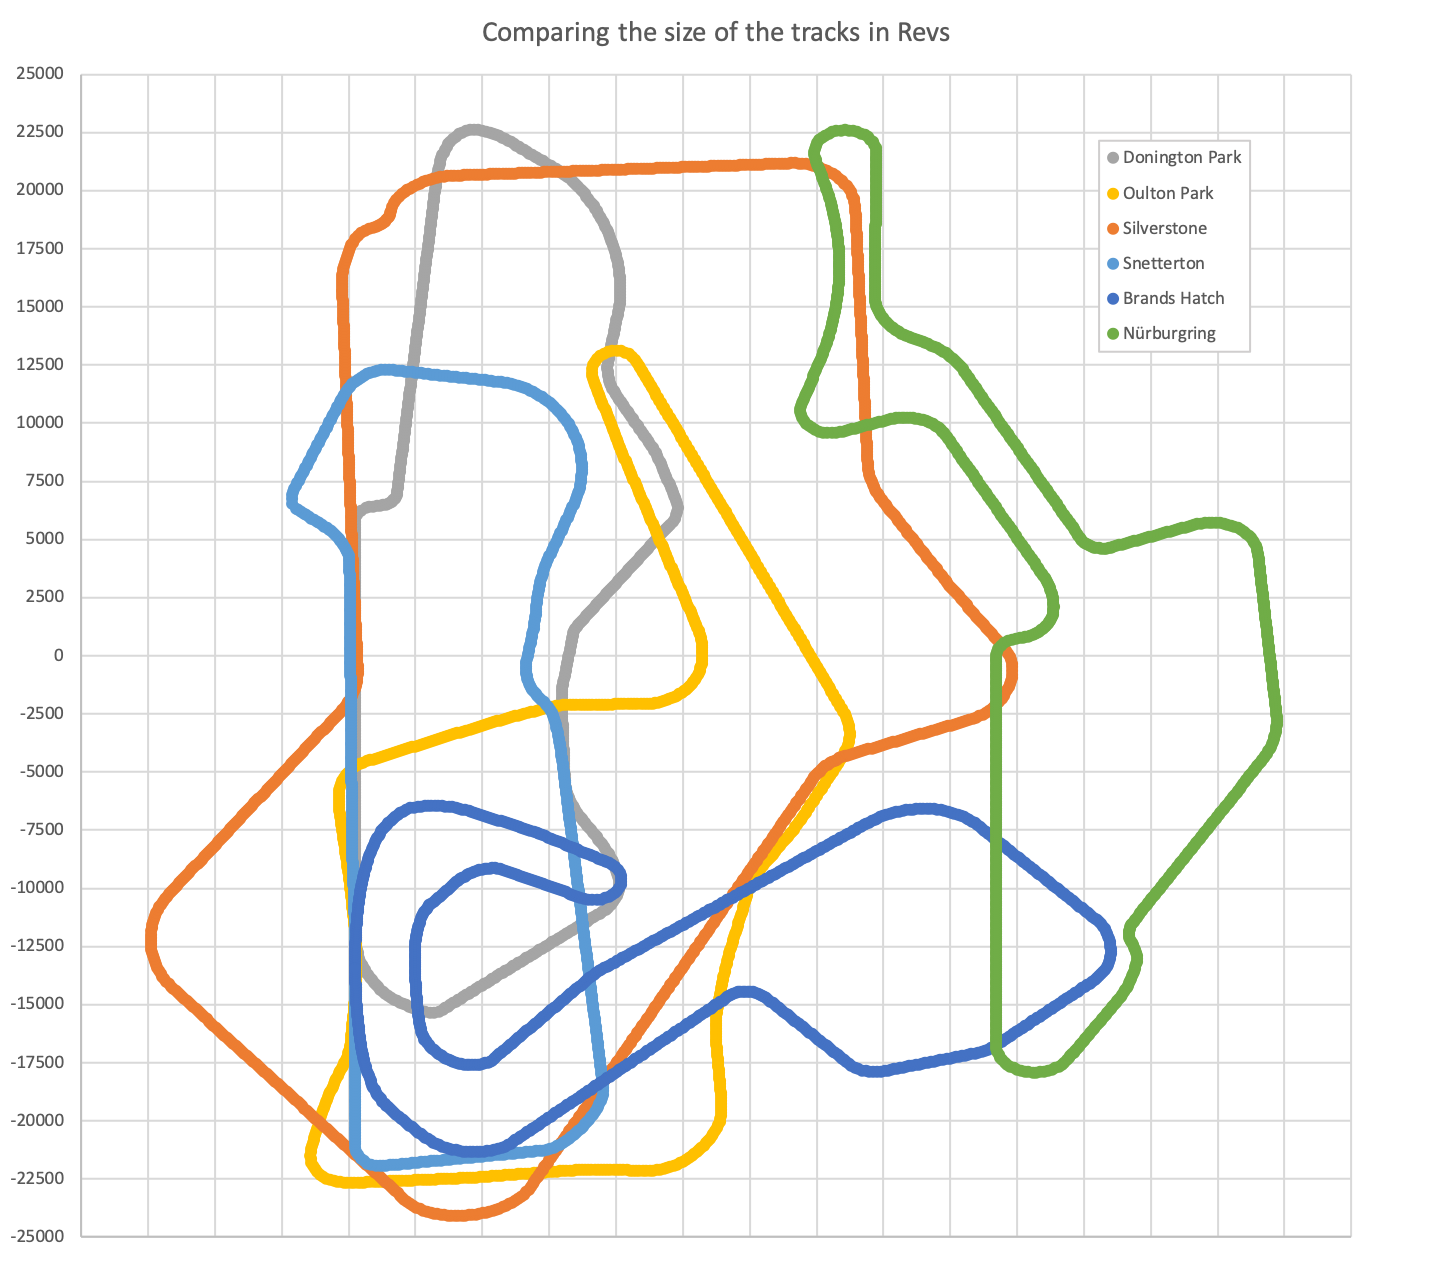
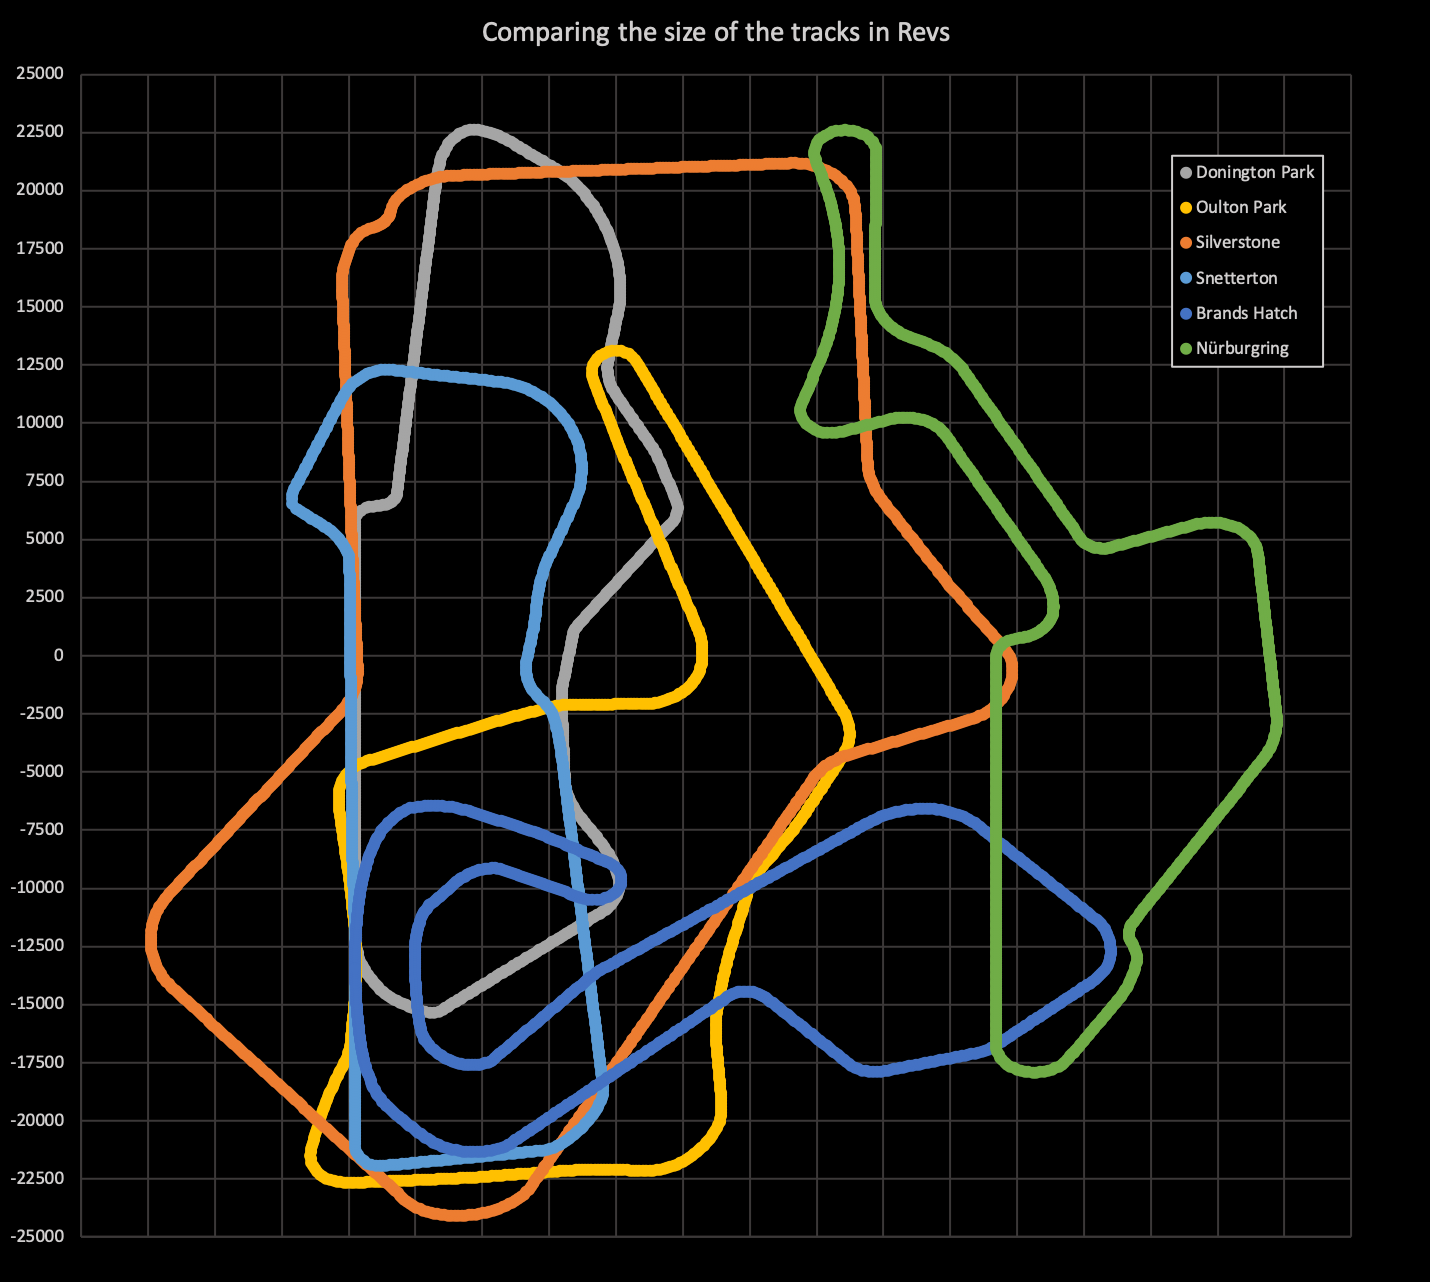
The following table shows the dimensions of each track in terms of longitude (x-coordinate) and latitude (z-coordinate):
| Track | BH | DP | NU | OP | SL | SN |
|---|---|---|---|---|---|---|
| Min longitude (x) | -12,256 | -12,252 | 4,396 | -13,932 | -19,906 | -14,628 |
| Max longitude (x) | 16,001 | -191 | 22,209 | 6,239 | 12,327 | -2,977 |
| Longitude span | 28,257 | 12,061 | 17,813 | 20,171 | 32,233 | 11,651 |
| Min latitude (z) | -5,608 | -15,344 | -1,506 | -22,664 | -24,079 | -21,945 |
| Max latitude (z) | 12,261 | 22,618 | 47,123 | 13,120 | 21,179 | 12,299 |
| Latitude span | 17,869 | 37,962 | 48,629 | 35,784 | 45,258 | 34,244 |
These coordinates are internal to Revs, but in the deep dive on building a 3D track from sections and segments we estimated that Silverstone is about 1.1km wide and 1.7km tall, so that should give you a sense of scale for the above diagram.
Comparing the track elevations
------------------------------
We can also analyse the y-axis, which gives us the height of the track above the ground (also known as its elevation). Specifically, we can use the y-coordinate data to plot an elevation profile for each track onto the same graph, to give a comparison of the gradient of each track. The graph starts from segment 0 on the left, though note this is not necessarily the same as the starting line:
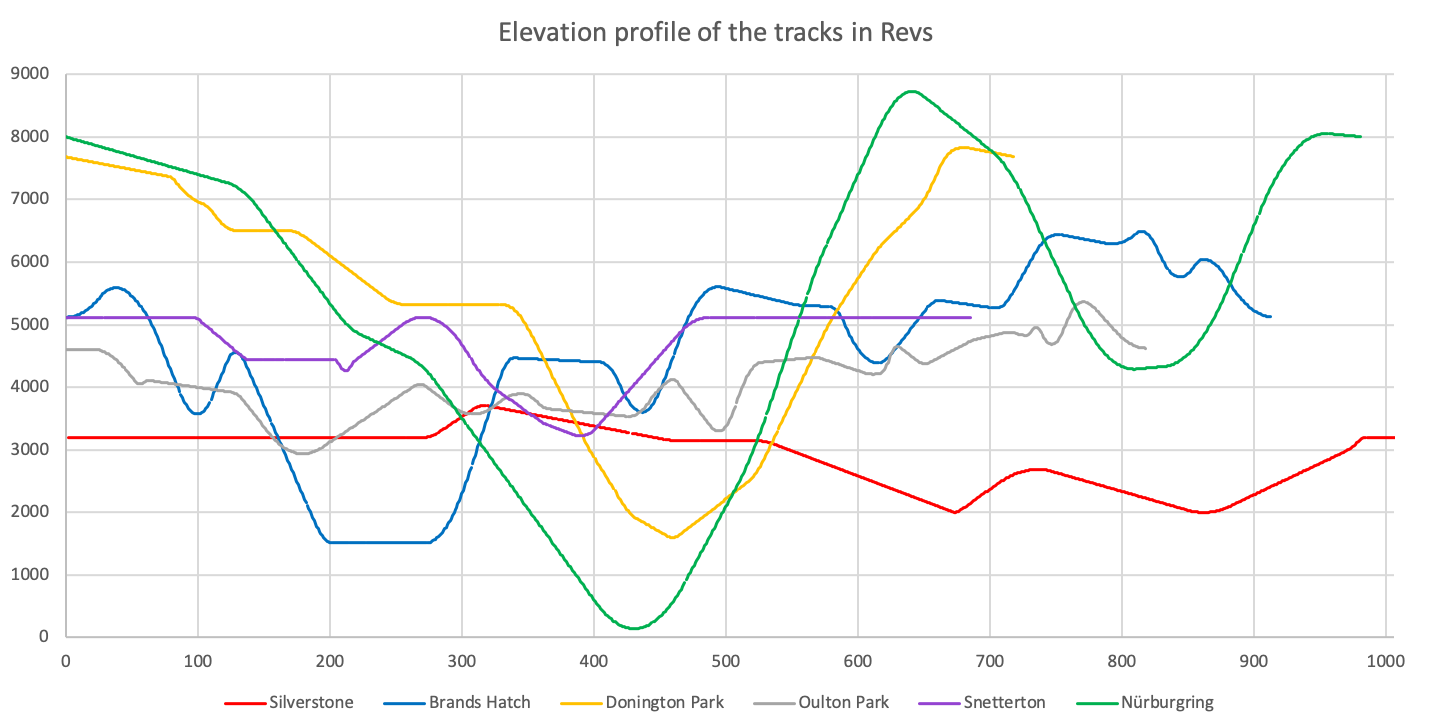
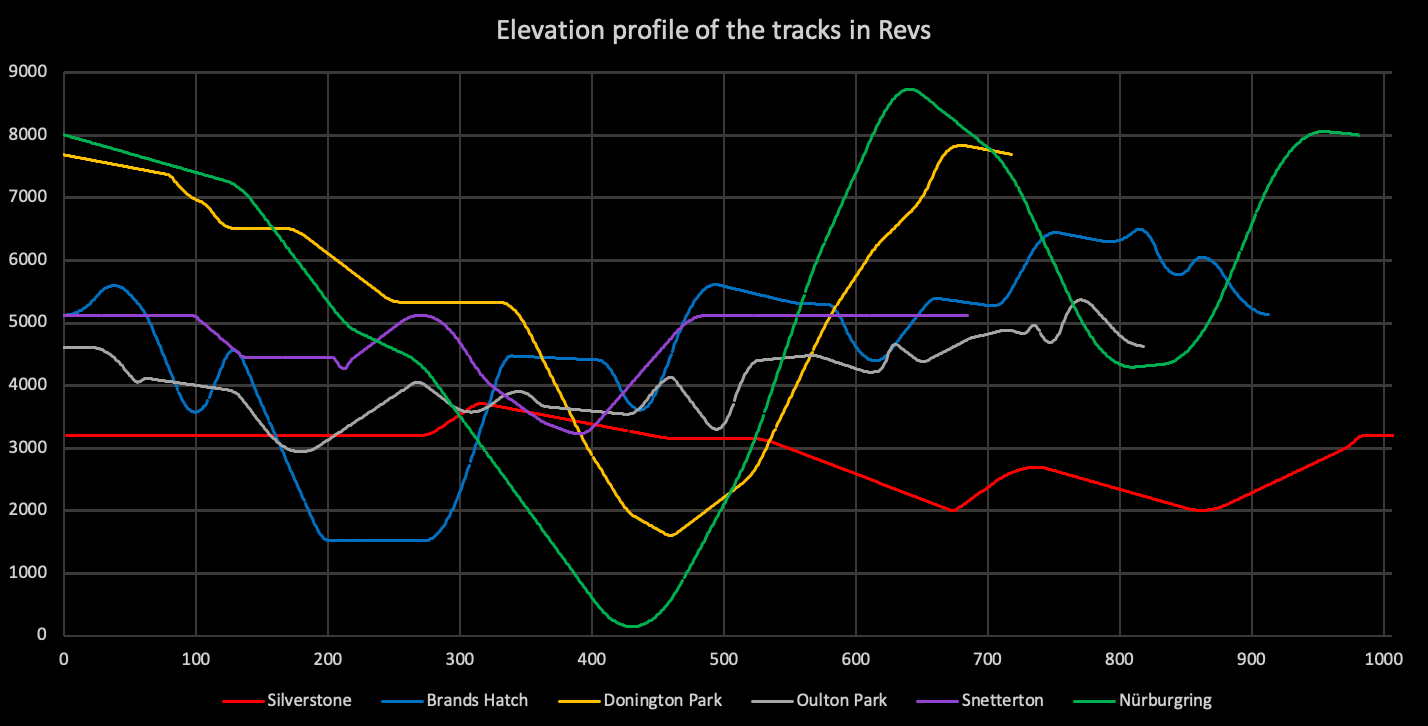
You can clearly see the difference between the hilly Nürburgring track in green, and the much flatter Silverstone in red. It's perhaps no surprise to learn that Silverstone was built on the site of an old airfield; the gradient gives this away nicely.
The following table shows the dimensions of each track in terms of elevation (y-coordinate):
| Track | BH | DP | NU | OP | SL | SN |
|---|---|---|---|---|---|---|
| Min height (y) | 1,515 | 1,596 | 142 | 2,935 | 2,000 | 3,223 |
| Max height (y) | 6,492 | 7,830 | 8,729 | 5,364 | 3,709 | 5,120 |
| Height span | 4,977 | 6,234 | 8,587 | 2,429 | 1,709 | 1,897 |
More track data
---------------
For more statistics and maps for the individual tracks, see the following deep dives:
- The Brands Hatch track
- The Donington Park track
- The Nürburgring track
- The Oulton Park track
- The Silverstone track
- The Snetterton track
After all, it wouldn't be motor racing without a mountain of stats...